ArcGIS Online is a complete, cloud-based mapping and analysis solution, delivering location intelligence to everyone. Connect people, locations, and data using interactive maps created with ArcGIS Online. Work with smart, data-driven styles and intuitive analysis tools. Share your insights with the world, or specific groups.
With ArcGIS Online you can
- Quickly create maps by dropping in your spreadsheet and mashing it up with other location data included in ArcGIS Online. Apply Smart Mapping styles to make your data visually stunning.
- Instantly share your maps with anyone, anywhere. Work collaboratively with your colleagues to build maps and apps.
- Use intuitive analysis tools that help you learn more about your data. Add valuable context to your data by combining it with Esri’s demographic and lifestyle data.
Use ArcGIS Online as a standalone solution for your mapping and analytic needs, or because it’s an integral part of the ArcGIS system, you can use it to extend the capabilities of ArcGIS Desktop, ArcGIS Enterprise, or use it to build custom apps using ArcGIS Web APIs and SDKs.
ArcGIS Online also provides access to the ArcGIS Living Atlas of the World, a vast collection of curated, authoritative, ready-to-use content from Esri and the global GIS user community.

December 2018 release
ArcGIS Online is updated regularly, and this latest release adds useful new features and enhancements. A new resource called Esri Maps for Public Policy is introduced, in addition to a new user type licensing model, new 3D capabilities, new configurable apps, and lots more. For additional details see the What’s new help topic or view all posts related to this release.
User types
User types now replace member levels as a more flexible way to license ArcGIS Online capabilities and apps. Administrators can assign user types with associated privileges and apps to better align with your organization, and the needs of your members. All members previously assigned Level 1 and Level 2 accounts now have Viewer and Creator user types respectively.

For more information see Introducing user types, or view the ArcGIS User Type Video Tour.
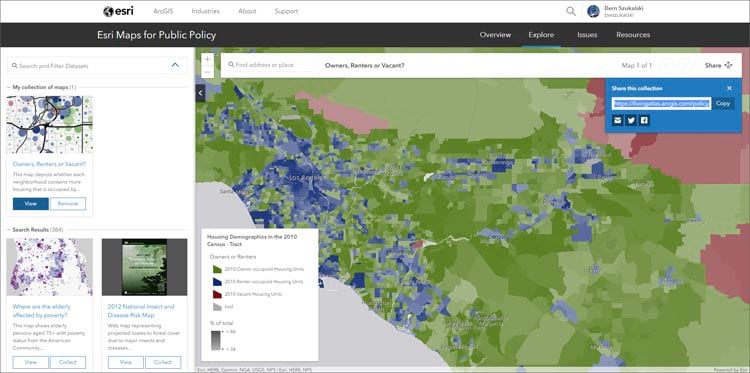
Esri Maps for Public Policy
Esri Maps for Public Policy is a free resource for policy makers to actively engage in community decision making. Powered by the Living Atlas, communities now have access to pre-authored maps from curated datasets that can be used to learn more about social equity and health, economic opportunity, transportation and infrastructure, resilience and sustainability, environment and natural resources, and public safety.
Policy maps create meaningful information from spatial data, showing opportunities to engage and intervene. Esri Maps for Public Policy provides an easy way to share maps as collections, allowing information to be shared with anyone. Maps may also be used as a starting point for further analysis within ArcGIS, helping to learn more about community problems quickly, and drive solutions.
Living Atlas
ArcGIS Living Atlas of the World is the foremost collection of geographic information from around the globe. It includes curated maps, apps, and data layers from Esri and the global GIS user community that support your work. Check out the ArcGIS Living Atlas of the World website, where you can browse content, view the blog, and learn how you can contribute. Here’s what’s new.
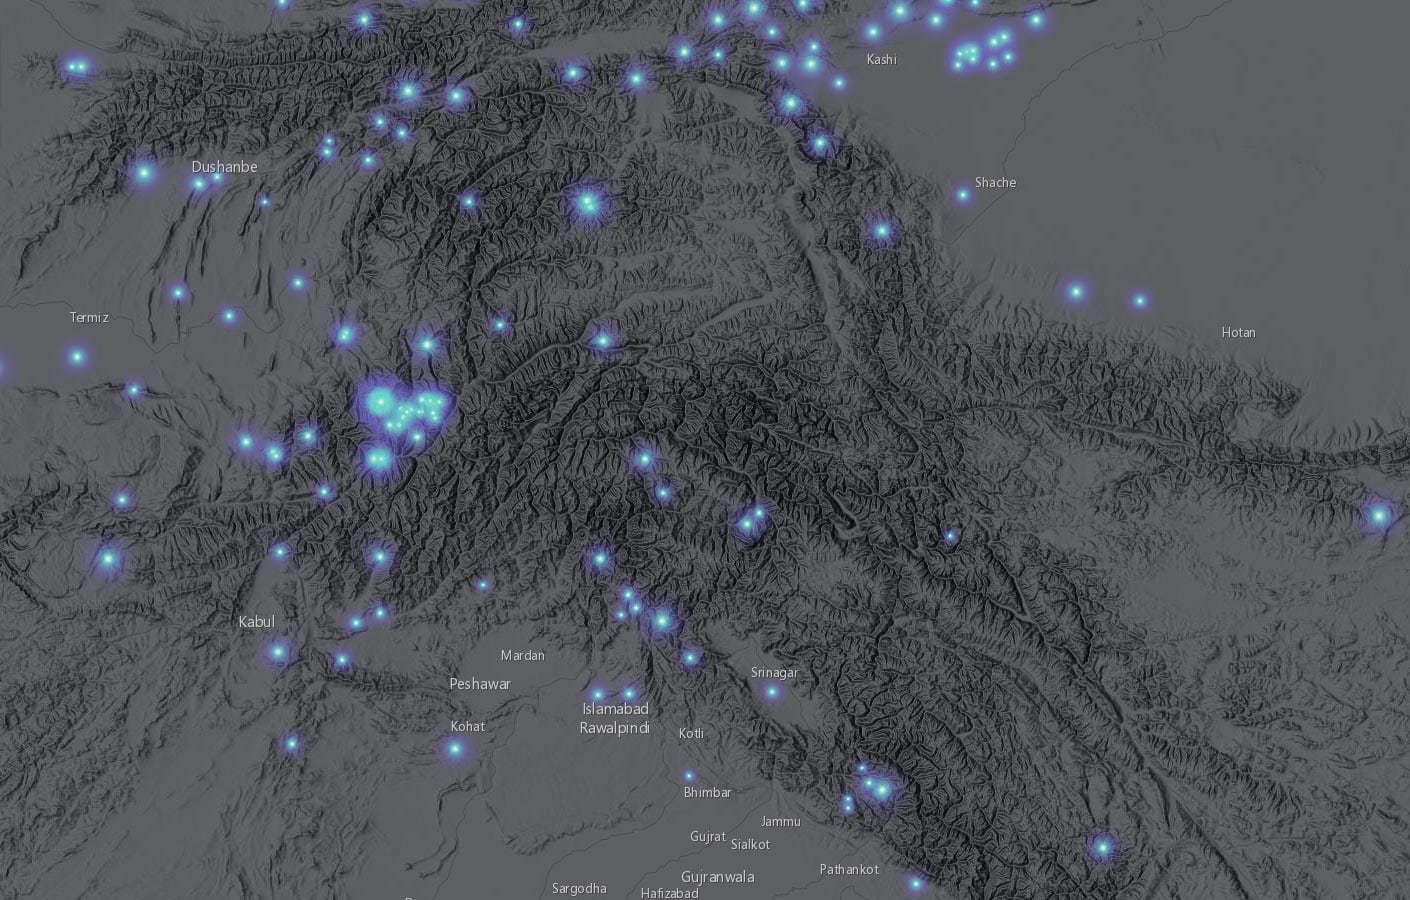
Dark Multi-Directional Hillshade (beta) is a new server raster function that can be applied to the World Terrain layer. The renderer can be set via the Image Display properties of the layer. This dark gray hillshade supports bright colors and labels for your theme, enabling you to create compelling visualizations. It will draw attention to your thematic content and provide context when used as a backdrop. See Introducing Dark Hillshade for more information.
Recently added to the Living Atlas is an 8-meter resolution elevation model covering the continent of Antarctica. The Reference Elevation Model of Antarctica (REMA) is the latest addition to Esri’s polar elevation services, adding a level of detail not previously available in a full coverage map of Antarctica, with layers optimized for exploration and computation. Use the Antarctic REMA Explorer to explore and visualize the layers.
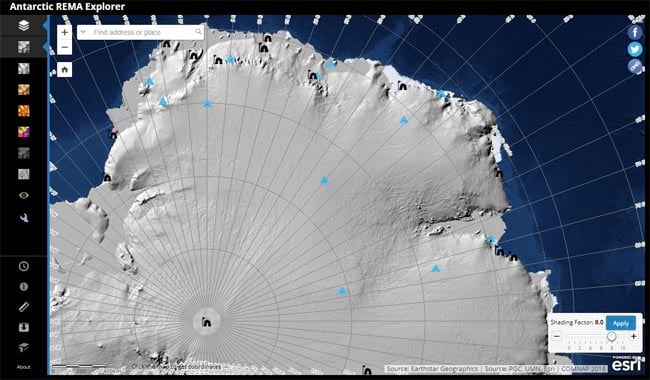
Also updated is the Arctic DEM, now including 2-meter resolution elevation data for the entire region. For more information on both, see High Fidelity Polar Elevation or explore the data using the Arctic DEM Explorer and the Antarctic REMA Explorer.
A new Oceans vector basemap (beta) is available. The basemap will be included soon in the Esri default vector basemaps group.
The Wayback imagery archive has been expanded with additional imagery layers, and now includes metadata for each of the imagery releases so you can determine the acquisition date and other details for a given location. The archive is now in general availability, and is no longer in beta. Use the World Imagery Wayback App to browse the archive, and to create web maps from archived imagery layers.
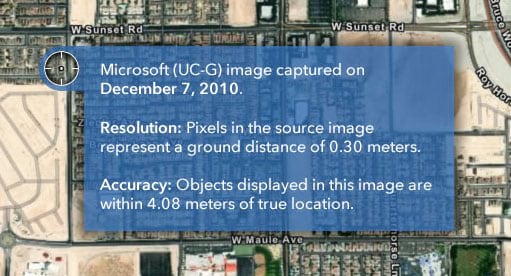
The World Imagery map has been updated with the latest DigitalGlobe EarthWatch Vivid imagery for several countries, as well the latest EarthWatch Metro imagery for a few hundred cities around the world.
Demographic maps for Canada, Germany, and several other countries have been updated using the latest data from our providers. For more information, see What’s new in Esri Demographics.
Esri vector basemaps are supported in more languages. In addition to Chinese (Traditional), English, French, German, Japanese, Russian, and Spanish, the basemaps are now available in Arabic, Chinese (Simplified), Italian, Korean, Polish, and Portuguese (Brazilian).
For the latest information, see the Living Atlas blog.
Learning and teaching
Whether you’re just getting started, trying to pick up new skills, looking for new ways to solve problems, or seeking help in bringing mapping and analysis into your classroom, Esri offers a wealth of self-paced tutorials, learning pathways, and curriculum builders to suit every need and skill level. Recent additions include the following resources.
Learn ArcGIS
Learn ArcGIS is a website with timely and engaging guided lessons that are based on real-world problems, covering the entire ArcGIS platform. These lessons use problem-solving exercises for hands-on experiences with real-world GIS applications. Whether you are new to GIS, or are a seasoned analyst, Learn ArcGIS has resources to help you build your GIS skills. Most lessons require membership in an ArcGIS organization. But if you don’t have ArcGIS yet, you can try it by joining the ArcGIS Learn organization, or signing up for a free ArcGIS trial to create your own organization.
Lessons as items
Learn lessons are now available as a group gallery of items, so you can easily find them in ArcGIS Online and share them into your organization. This makes them even more valuable as resources to learn new techniques, workflows, and methods.
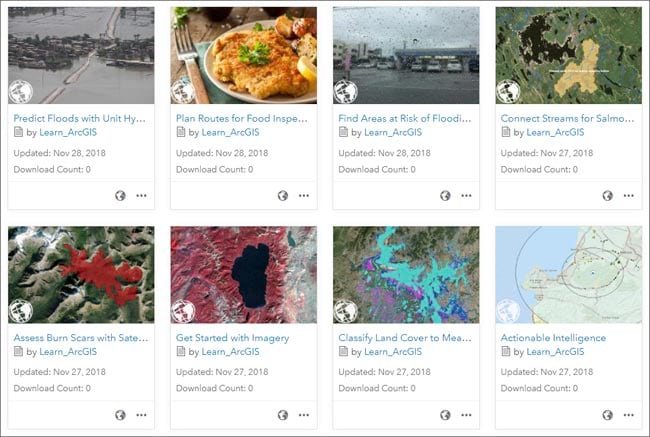
View lessons by date, title, views, or rating, and open the items to favorite them for your use, or share within your organization.
New lessons
There are new hands-on, real-world scenarios available, including:
- Predict Weather with Real-Time Data: Explore real-time weather data, make predictions, and interpolate surfaces. (coming soon)
- Policy Mapping – Improve Newborn Health: Identify counties in need of low birth weight intervention. (coming soon)
- Visualize Predicted Economic Growth: Use a 3D image to show projected job and housing growth.
Learn Paths
Learn Paths are collections of our best hands-on content for building a strong foundation of knowledge of the platform and its capabilities. New paths include:
- Introduction to Policy Mapping: Learn how to use the Living Atlas, with its myriad of maps and data layers, to make policy maps and apps that reveal community insights otherwise hidden in the data. (coming soon)
- Try ArcGIS for Ocean Solutions: Learn about and map the ocean by collecting data, integrating and sharing with other sources that inform our understanding.
Teach with GIS
Teach with GIS is a new resource that provides implementation guides and a curriculum builder for discovering engaging K-12 resources for a GIS-enabled classroom. New additions include:
- Build a GIS Portfolio: A teachers’ guide for integrating mapping and location analytics in any classroom.
- Implementation Guide for the Classroom: A teachers guide for integrating mapping and location analytics in any classroom.
- Midterm Elections 2018: Present a series of analytical political maps that show both historical trends and predictions of future campaigns.
- Hurricane Michael: Before and After Images of Destruction: Use a NOAA Web Map Tile Service to obtain and compare imagery of Mexico Beach, FL before and after Hurricane Michael.
For more information visit the Learn ArcGIS website.
ArcGIS Companion
ArcGIS Companion makes it easy to access your organization from your mobile device. In addition to the mobile browser option (just use your URL), you can now access your organization using this companion mobile app for iOS and Android. Access your organization anytime, anywhere, to explore content, view groups, edit your profile, and more.

New capabilities for this release include the following:
You can now search groups inside and outside your organization. You can also edit group details (including tags and delete protection). The overall search experience has been improved by combining the search for content, groups, and members into one. Your notifications in Companion now include group membership requests.
For more information, see What’s new in ArcGIS Companion.
Insights for ArcGIS
Insights for ArcGIS is web-based data analytics made for advanced location intelligence. Answer questions, analyze data completely, and tell powerful data stories. Connect to your data directly, then use maps, charts and tables to perform basic to complex analyses that scale based on skill level and business need.
The December 2018 update of Insights for ArcGIS is a quality release to improve the performance of the software. There are also three new quick lessons you can use to create your first workbook, solve a spatial problem, and share your analysis. For more information, see What’s new in Insights.
Mapping and visualization
You can now set a refresh interval on tables in web maps. This ensures that tabular information related to your map remains in sync with the latest data from the field while the map is being viewed.
Attribute expressions now support referencing other layers in your map.
When configuring pop-ups for a feature layer in your map, you can create Arcade expressions that reference other feature layers. You can also reference other layers when performing field calculations using Arcade.
Spatial analytics
New street barriers
You can now apply point, line, and area barriers on streets when running the Find Nearest, Create Drive Time Areas, Plan Routes, Connect Origins to Destinations, and Choose Best Facilities tools.
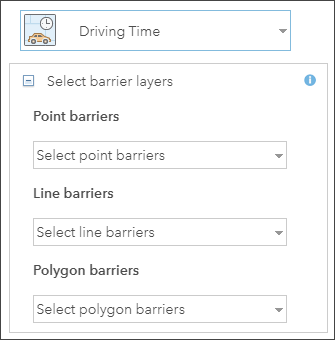
A point barrier can model a fallen tree, an accident, a downed electrical line, or anything that completely blocks traffic at a specific position along the street. Travel is permitted on the street but not through the barrier.
A line barrier prohibits travel anywhere the barrier intersects the streets. For example, a parade or protest that blocks traffic across several street segments can be modeled with a line barrier.
A polygon barrier prohibits travel anywhere the polygon intersects the streets. One use of this type of barrier is to model floods covering areas of the street network and making road travel there impossible.
For more information view the Add Barriers video.
Reduced routing credits
Esri has reduced the price of simple routing to 0.005 credits per route. For example, generating 10,000 routes now costs 50 credits, instead of 400 credits.
3D scenes
Scene Viewer lets you author, view, and share 3D scenes. With this release, Scene Viewer includes the following enhancements and new capabilities.
Slice tool
Reveal hidden data in building interiors or underground using the Slice tool. The tool lets you inspect features in a building, or display geologic or structural data beneath the surface.

Large datasets
You can now add thousands of lines and polygons using Scene Viewer, allowing you to display and visualize large datasets containing features such as streets, rivers, parcels, and country borders. Adding to the support for large point datasets previously available, this enhancement removes the feature count limit for adding layers in Scene Viewer.
Performance with 3D symbols
Performance of scenes with point layers styled with 3D symbols from the Esri-provided gallery has greatly improved. With the new automatic level of detail, you can now display tens of thousands of realistic trees, cars, and other models while maintaining strong performance.
Filter by attributes
Scene Viewer now allows you to apply a filter on your feature or scene layers. Simply choose an attribute and select which features should appear in the scene. This new feature is available in the Layer Properties option for layers of all geometry types, including point cloud layers.
Building scene layers
Explore the fine details of buildings in scenes using new building scene layers. Building scene layers allow you to display and hide exterior and interior structures like facades, walls, doors, and mechanical systems.
Layer search
A new experience for adding layers allows you to search for layers in Scene Viewer using a variety of filters, sort search results, and select layers from the ArcGIS Living Atlas of the World, your groups, or your Favorites.
Data management
Three new feature layer templates support data collection and management of natural resources. Forestry professionals can catalog forest activities such as chemical applications and harvest activities with Forest Activity Tracking. Local dealers in the agricultural industry can use Member Properties to update client addresses and inventory property assets such as barns, irrigation systems, fencing, and storage facilities. Vineyard and winery staff can collect and manage vineyard data with Vineyard Management.
When you create a hosted feature layer view from a hosted feature layer that has attachments enabled, you can hide attachments for individual layers within the view. This allows you to provide view users with access to the feature data without exposing attachments.
Administration
The following changes have been made to organization administration for this release:
The workflow for adding members to the organization now includes steps to assign add-on licenses and specify additional member settings such as profile visibility and start page.
When searching for and managing members in your organization, you can now see and select several members at once. The selected set of members is maintained while you search for and filter all the members in your organization, even across multiple pages. The redesigned members page also includes new options for managing add-on licenses and user types, either for a single member or for a selected set of members.
The licenses page has been redesigned. Two tabs provide information about your organization’s add-on licenses and user types, including compatibility tips that help you make decisions when managing licenses. You can still see how many add-on licenses are assigned and available, and assign or unassign them as needed.
A new tutorial is available to help you configure G Suite as your identity provider for enterprise logins.
Configurable apps
Configurable apps use templates that you can configure easily, without any coding. They help you publish apps quickly for a variety of users and workflows. Configurable apps are the fastest and easiest way to go from a map to a shareable app. You’ll be a hero in minutes! There are lots of configurable apps to choose from depending on the needs of you and your audience, what you need the app to do, and how you need it to look. New for this release:
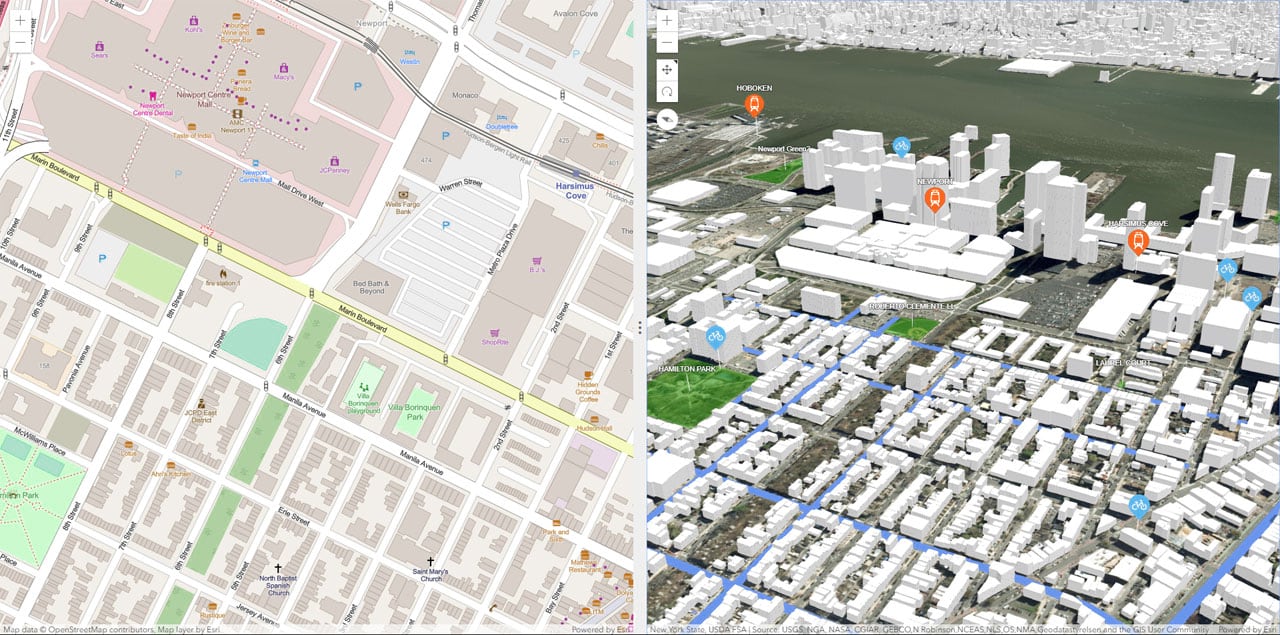
Compare is a new app that supports side-by-side or stacked comparison of two maps or scenes. You can configure the app to compare two scenes, two maps, or one of each. The two views can be linked or unlinked depending on whether you want to show the same location or not.
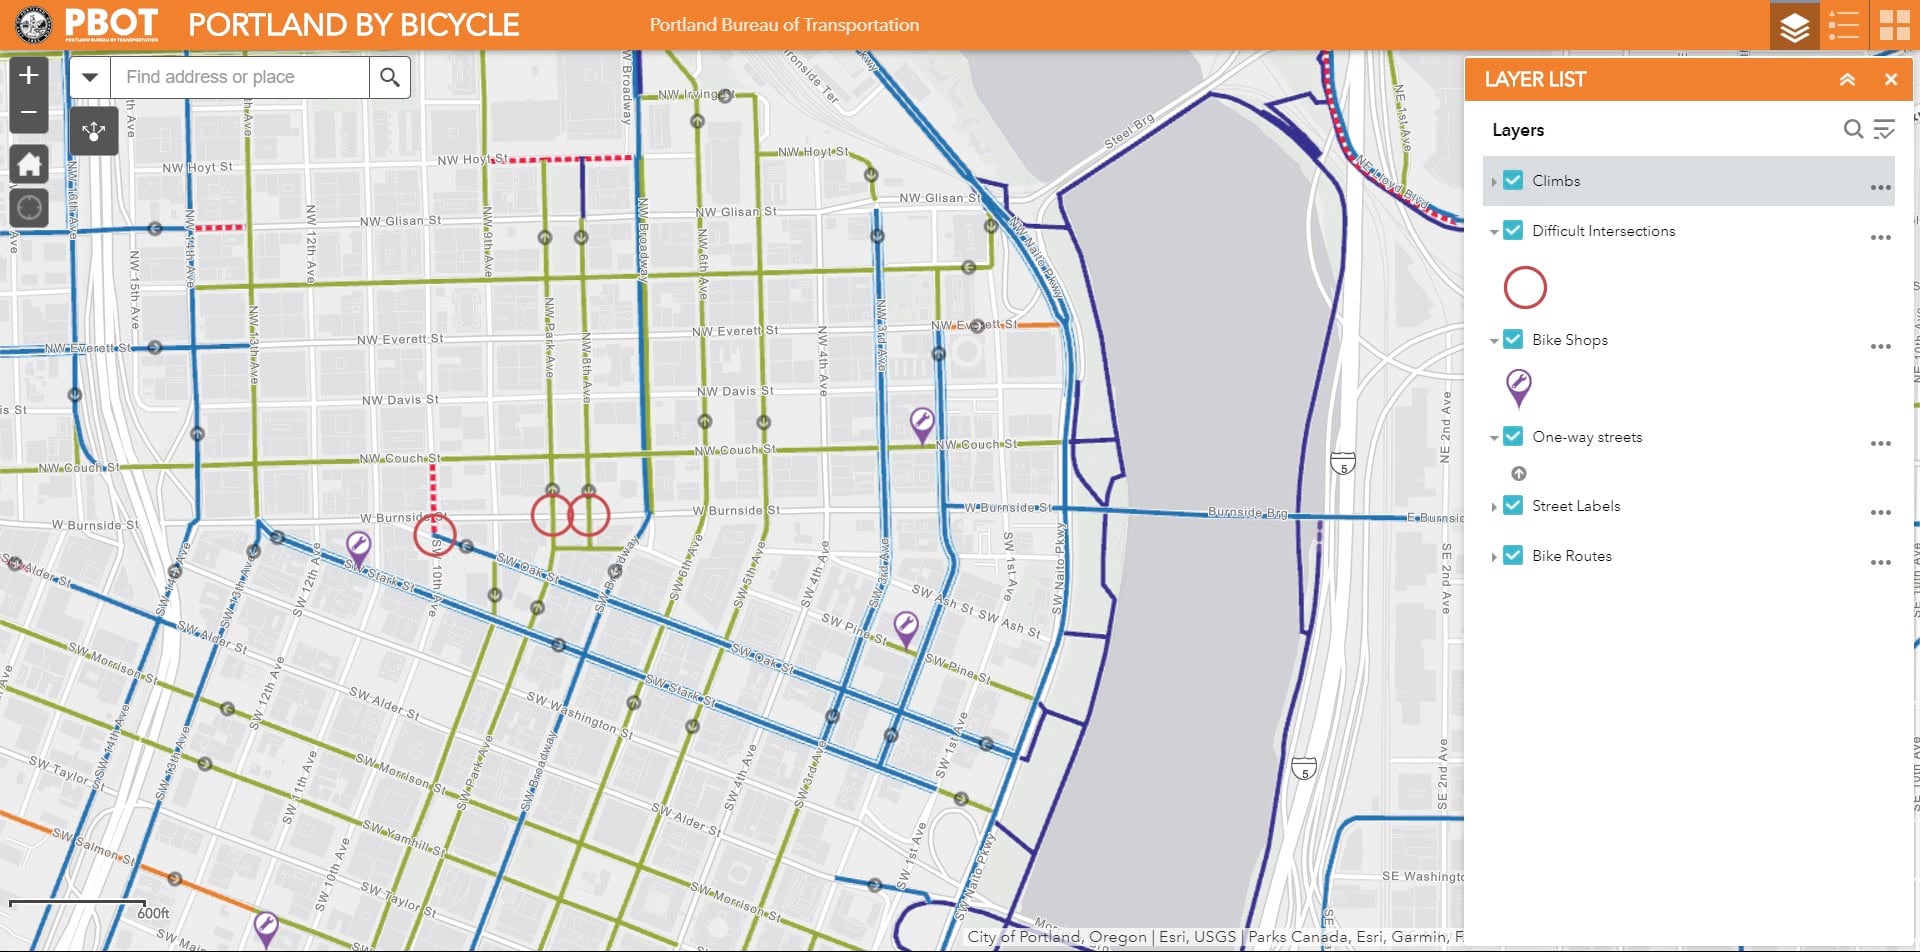
Layer Showcase allows you to display a collection of layers in both 2D and 3D. The app is no longer in beta. Layer Showcase also now enables you to set the default extent of the opening view.
Feature search is now configurable for Map Styler and Media Map.
Category Gallery, introduced this release in beta, is a new configurable app for group content. It enables browsing by group or organization categories.
The following apps are now in Mature Phase and have been removed from the Esri default app gallery: Compare Analysis, Compare Scenes, Map Carousel, Map Tools, Simple Map Viewer. Existing apps created with these configurable templates will continue to work. For recommended alternatives and more information, see Configurable apps announcement.
App Builders
App builders let you easily create custom apps, no coding required. App builders have been updated with the following enhancements:
Web AppBuilder
Web AppBuilder for ArcGIS offers a way for you to easily create HTML/JavaScript apps that run on any device, using a gallery of ready-to-use-widgets. You can customize the look of your apps with configurable themes, and can host your apps online or on your own server.
Web AppBuilder for ArcGIS has two new widgets and numerous improvements to existing widgets. The new Threat Analysis widget targets public safety personnel and first responders. The widget helps identify safe distances and zones for planning events. The new Visibility widget determines what is visible based on distance, observer’s height, and a field of view.
In addition, Directions now allows you to configure barriers from your map layers. Analysis adds three more tools; Find Centroids, Find Point Clusters, and Summarize Center and Dispersion. 3D Search enables you to search feature layers.
For more information, see What’s new in Web AppBuilder for ArcGIS.
AppStudio for ArcGIS
AppStudio for ArcGIS lets you transform your maps into mobile apps ready for Android, iOS, Windows, Mac OS X, and Linux, and enables you to publish them using your own brand to all popular app stores – no developer skills required. With AppStudio for ArcGIS, organizations on the ArcGIS platform now have the ability to build cross-platform native apps in a snap.
Anticipated for release December 12, AppStudio for ArcGIS 3.2 includes updated dependencies: ArcGIS Runtime 100.4 and Qt 5.11.2. AppStudio Desktop has a number of improvements for composing emails, as well as notification and vibration support for UWP apps. AppStudio Player now supports downloading and viewing public apps, even without signing in. Player also has a new onboarding page, and dark theme. The template apps have many new features, improvements, and fixes. The Map Tour has an improved workflow for downloading offline maps. The Quick Report template now supports MMPks created using ArcGIS Pro Publisher extension with anonymous use enabled. For more information, see What’s new in AppStudio for ArcGIS. (Whats new will be updated post-release).
Operations Dashboard
Operations Dashboard enables you to use maps alongside charts, gauges, and other visual elements to reflect the status and performance of people, services, assets, and events in real time.
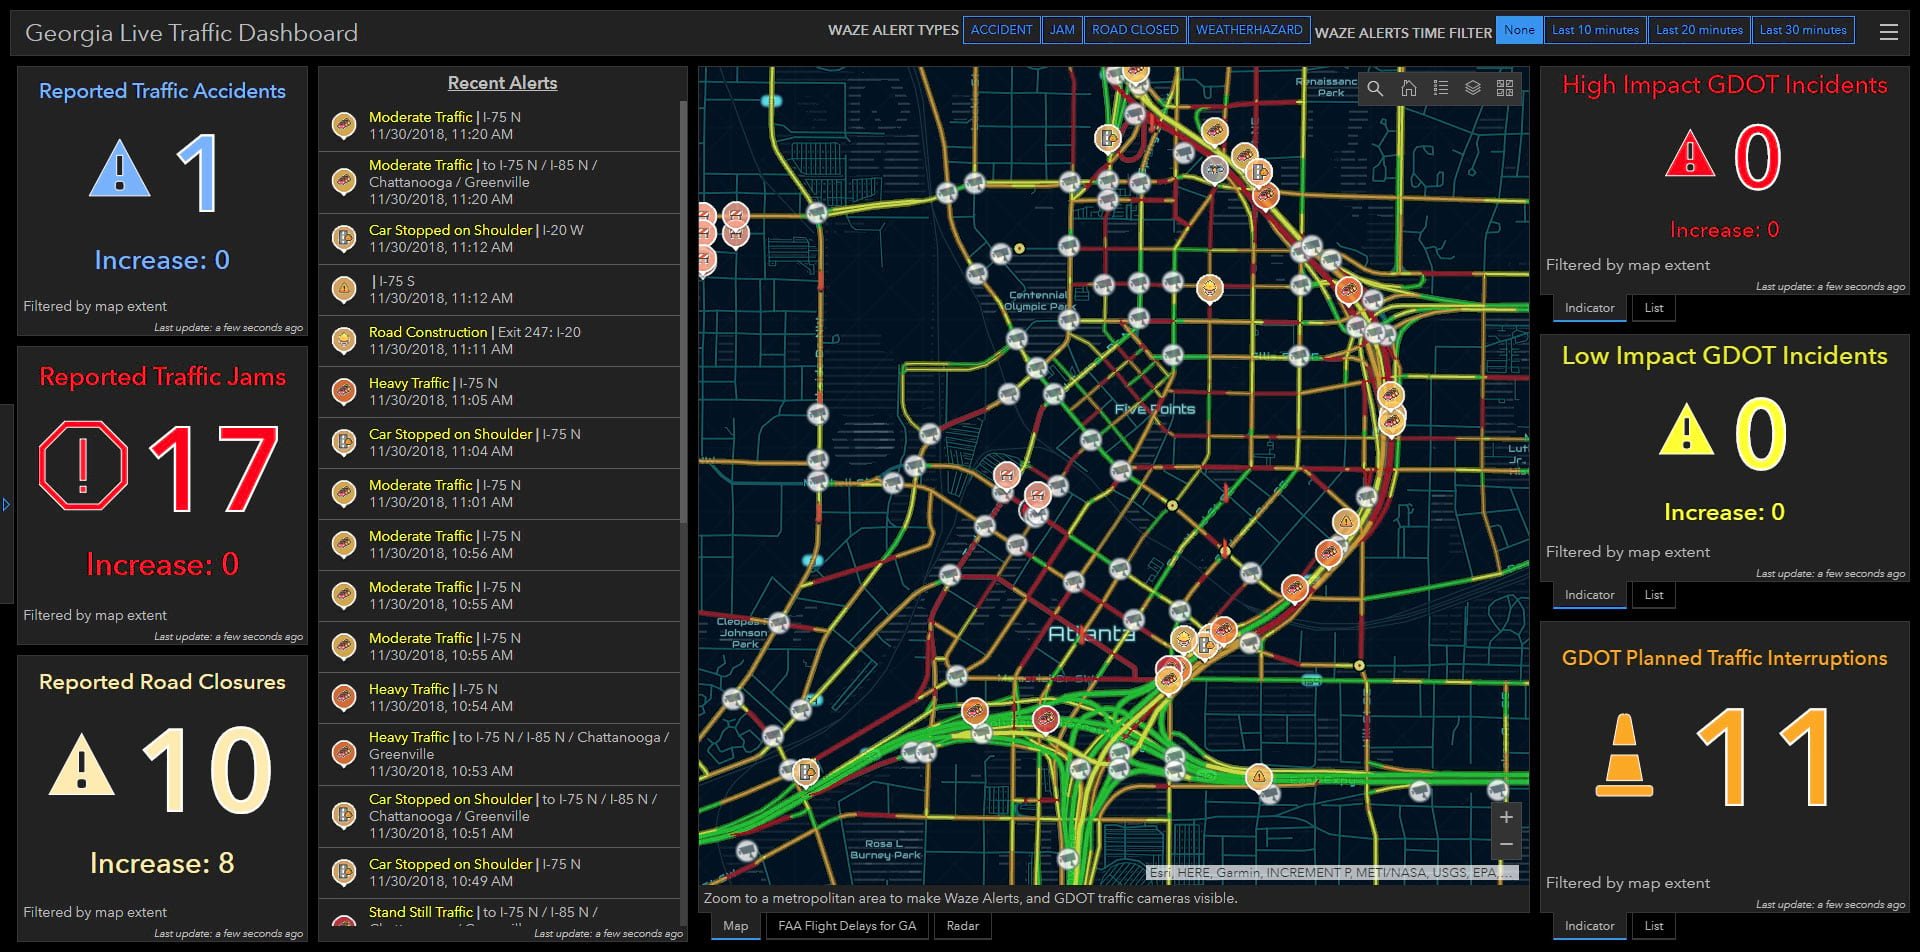
The Operations Dashboard for ArcGIS update introduces new configuration options through URL parameters providing more flexibility in dashboard configuration. Designed to trigger actions at runtime, several different parameter types are available: category, numeric, date, feature, and geometry. This means you can now configure Dashboards to load based on a specific property, for example at a certain spatial extent, or with a specific filter applied. For more information, see What’s new in Operations Dashboard for ArcGIS.
Apps for the field
ArcGIS Apps for the Field help you use the power of location to improve coordination and achieve operational efficiencies in field workforce activities.
Collector for ArcGIS
Collector for ArcGIS enables the use of your smartphone or tablet to collect and update information in the field, whether connected or disconnected.
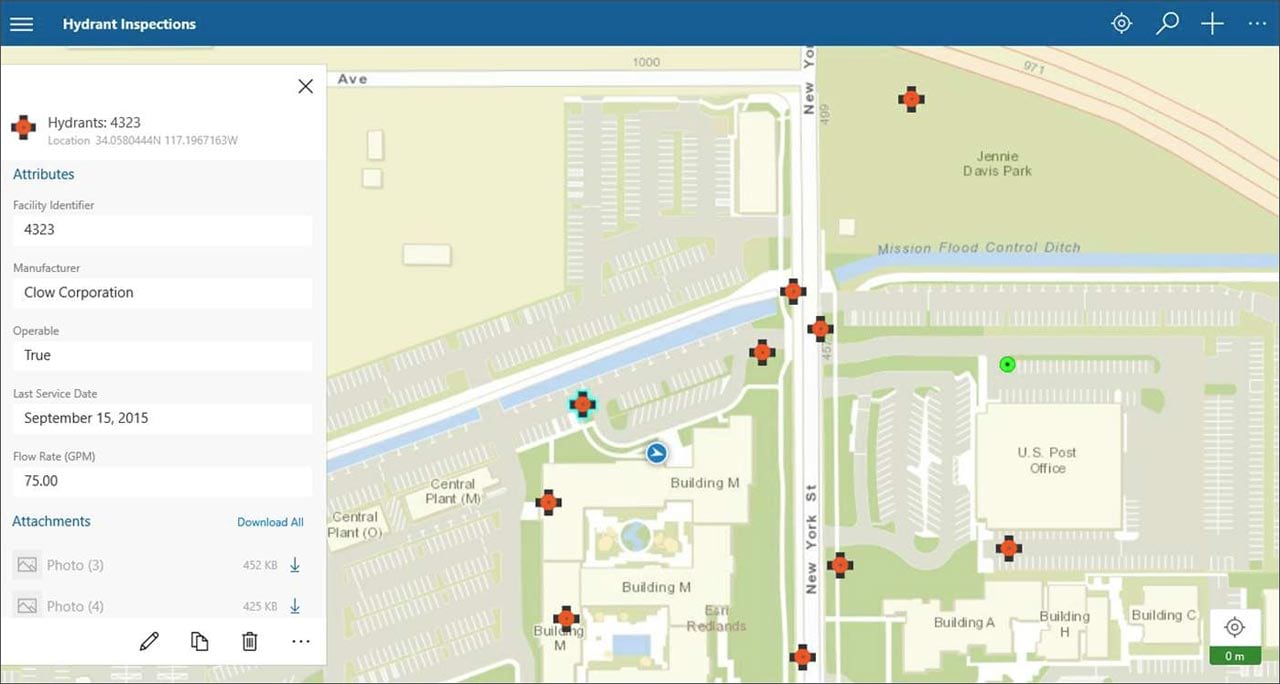
Collector for ArcGIS has released a new iOS app and updated the existing iOS app, renaming it Collector Classic. The new Collector app brings better-looking, more performant maps to your devices, complete with labels, vector basemaps, and rich symbology. Forms get Arcade expression support and easier camera access and data entry.
The user experience is refreshed, and you can see the map and form at the same time on phones or use your tablet as a digital clipboard. Use a location target to place points, keeping your finger out of the way. If you work offline, take advantage of the preplanned map areas you can create when authoring maps, and automatically sync changes. You can even collect 3D data. For more information, see What’s new in Collector for ArcGIS.
Apps for the office
ArcGIS Apps for the office enable operations managers and analysts to visualize data in a geographic context to gain location-based insights and make decisions that save money and time. Some apps for the office have been updated. Here are a few highlights:
ArcGIS Business Analyst Web
ArcGIS Business Analyst Web is a web-based solution that applies GIS technology to extensive demographic, consumer spending, and business data to deliver on-demand analysis, presentation-ready reports and maps. Select from a wide variety of existing reports, or create custom reports to meet your marketing needs.
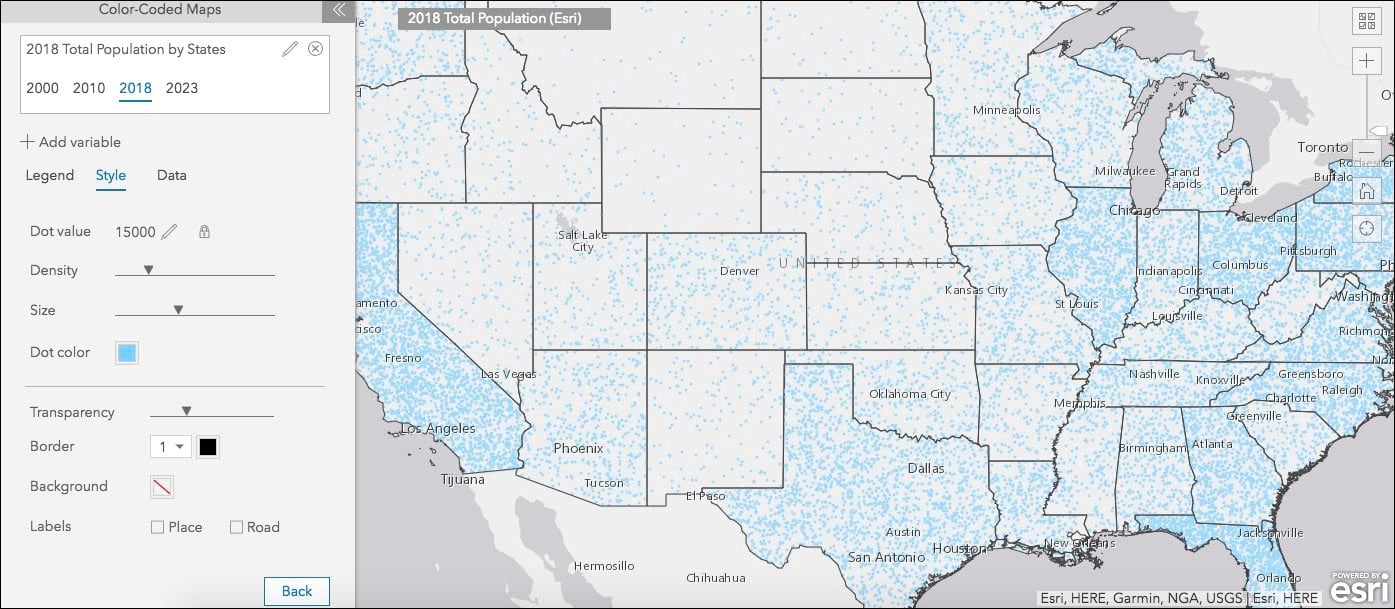
The latest update of ArcGIS Business Analyst Web App allows you to create dot density maps, use infographic templates across organizations and countries, edit site attributes and validation, categorize and browse your own data more easily, and much more. For more information, see What’s new in ArcGIS Business Analyst.
ArcGIS Earth
Explore any part of the world with ArcGIS Earth. Work with a variety of 3D and 2D map data formats, including KML. Display data, sketch placemarks, measure distances and areas, and add annotations. ArcGIS Earth 1.8 introduces a variety of new features and enhancements, and is available to download from Esri.com or the Microsoft Store. Highlights include interactive 3D analysis, with tools supporting elevation profiles, line-of-sight analysis, viewshed analysis, and 3D measurements.
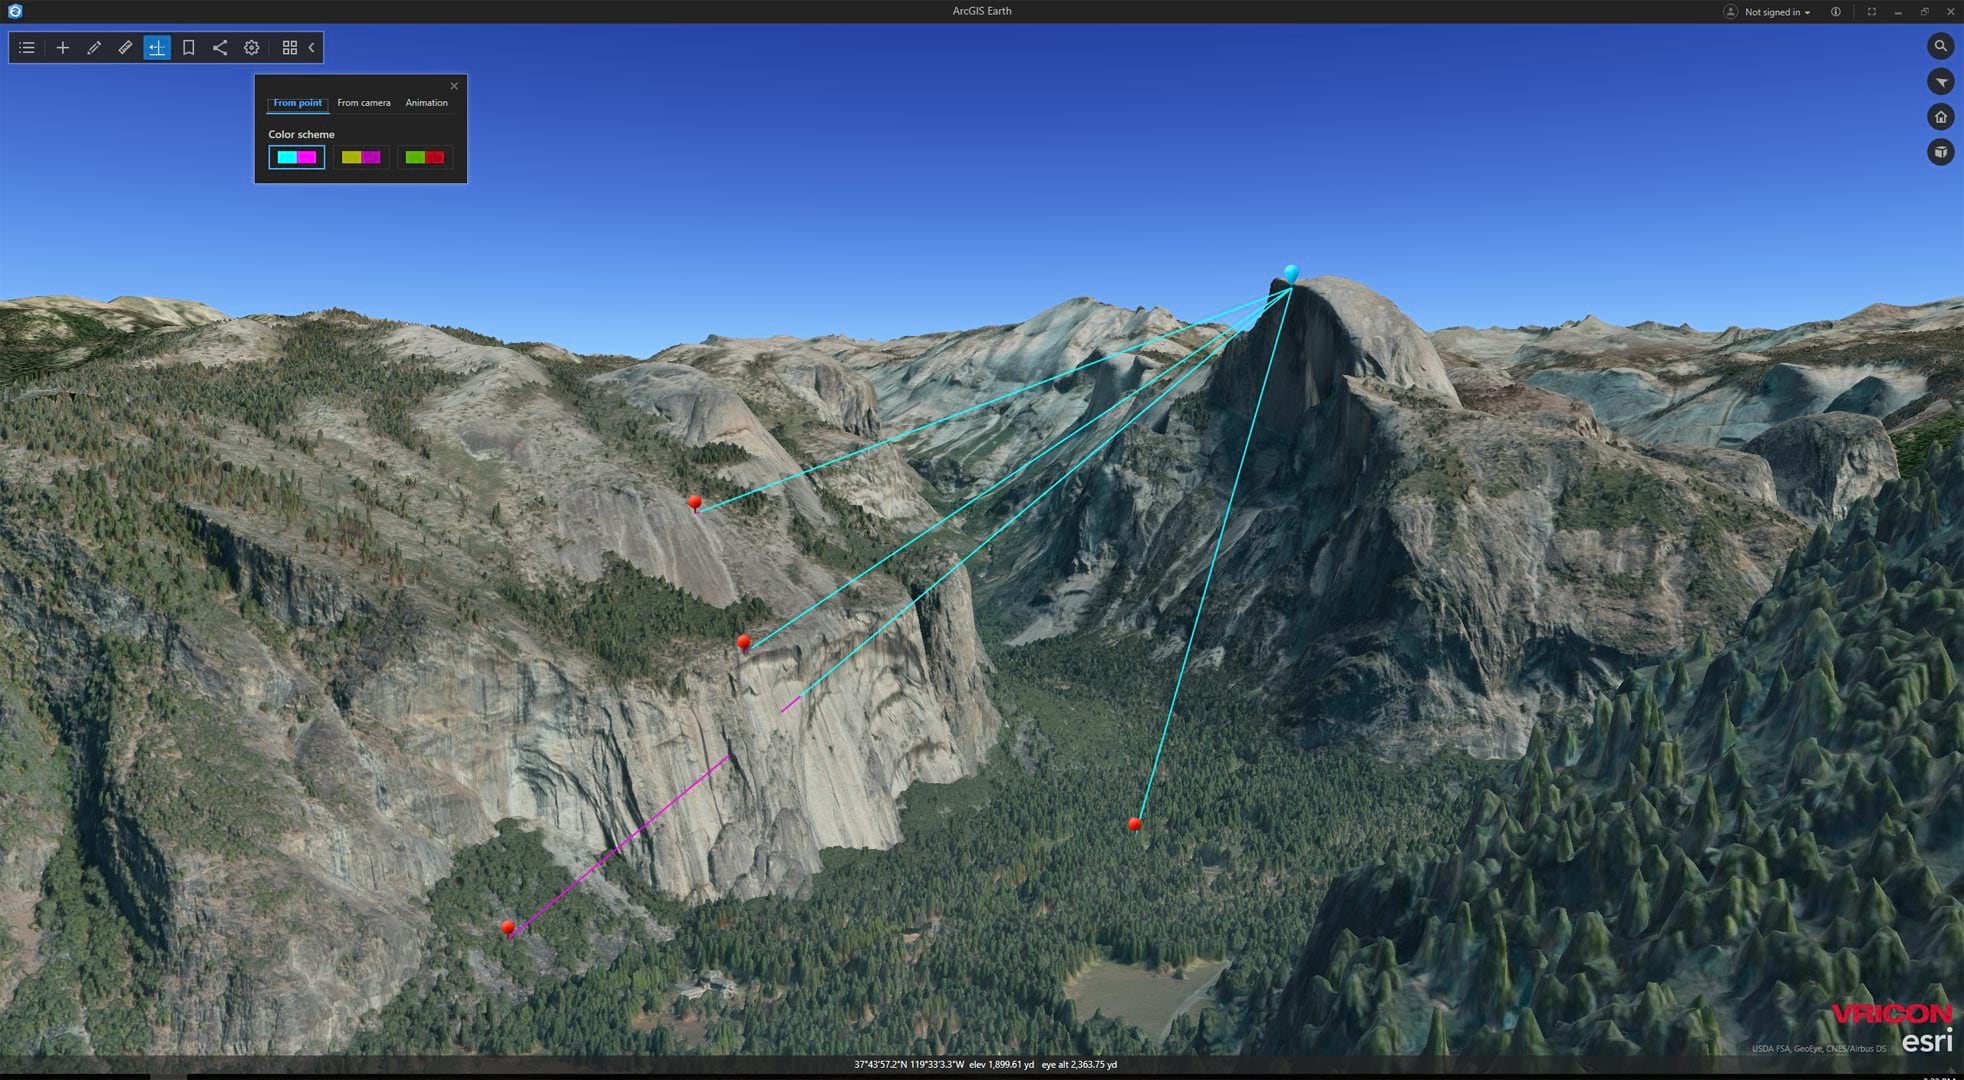
In addition, this update includes new capabilities such as bookmarks, 3D explore mode for navigation, and supported new data types including web scenes, web maps, and portal items. Moreover, the alpha version of ArcGIS Earth Android is available for download from the Esri Early Adopter Community or Google Play. For more information, see What’s new in ArcGIS Earth 1.8 or Introducing ArcGIS Earth v1.8.
ArcGIS Maps for Adobe Creative Cloud
With ArcGIS Maps for Adobe Creative Cloud, creative professionals can access and design with data-driven maps inside Adobe Illustrator and Photoshop.
The latest release of ArcGIS Maps for Adobe Creative Cloud includes custom projections, sharing items back into ArcGIS Online, and the option to select items as favorites. Once you’ve created a map with the extension, save your map back into ArcGIS Online to share with your organization. Use the Favorites button when adding layers or web maps to organize content that you frequently use. You can also specify custom projection parameters for your compiled map. This release also introduces the ability to define an extent from a layer, a map, or a file saved on your computer. For more information, see What’s new in ArcGIS Maps for Adobe Creative Cloud.
ArcGIS Maps for Power BI
With ArcGIS Maps for Power BI you can unlock the power of location in your business intelligence in Microsoft Power BI. Use ArcGIS Maps to create beautiful map visualizations that surface patterns and trends in your data, and gain context with demographic data.
ArcGIS Maps for Power BI now includes a new Find Similar feature that lets you locate features with attributes comparable to those of other features selected on the map. The selection toolbar has been improved to show more of the map while you’re working, and you can now geocode using SLA codes. For more information, see What’s new in ArcGIS Maps for Power BI.
ArcGIS Hub
With sites, events, configurable apps, and other solutions, ArcGIS Hub enables your team to create and share initiatives that align collaborators across organizations and communities with the information and content they need to manage projects and drive desired outcomes.
Recent enhancements to ArcGIS Hub include a beta search capability and support for file geodatabase downloads, making it easier for you to find and share lots of data. You can also add more content to your hub sites faster with updates to the gallery card and the new media card. Ever wonder how many people are connecting with your sites? Check out the new site dashboard to see how many views you get over time. Also updated are user profiles, and how you get notifications. For more information see What’s New in ArcGIS Hub (December 2018) or the ArcGIS Hub website.
Python workflows
The ArcGIS API for Python provides simple and efficient tools for automating tasks in your ArcGIS organization, as well as performing GIS analysis and visualizing your spatial data. ArcGIS API for Python integrates smoothly with the open-source Python ecosystem, including the popular Jupyter Notebooks.
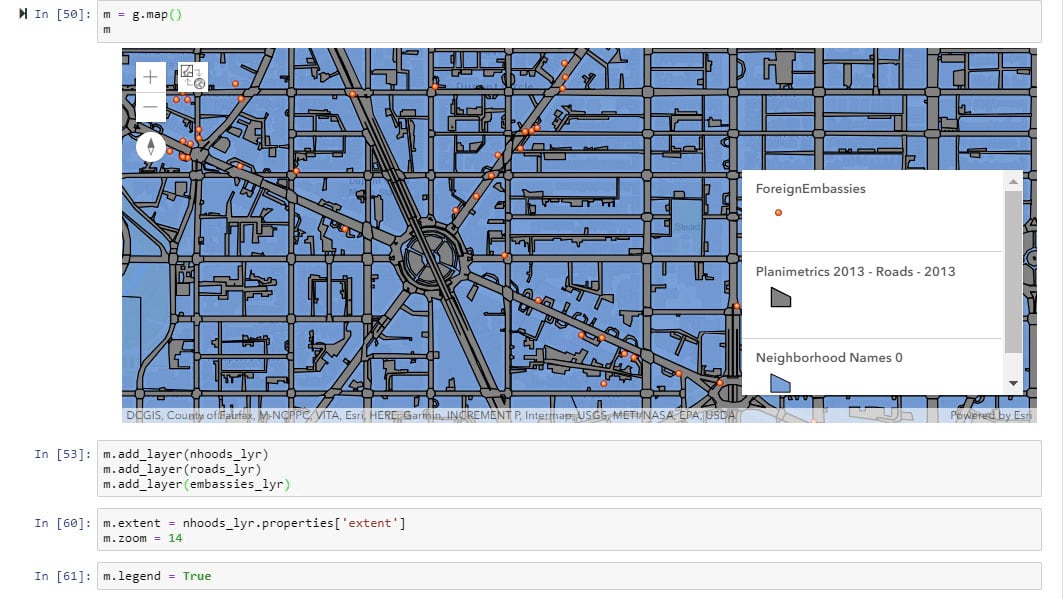
The Python API v1.5.1 has recently been released, with a new Survey123 module, map legend, and other enhancements. Version 1.5.2 will coincide with this release of ArcGIS Online, and will include changes to accommodate user types. For more information see ArcGIS API for Python.
Miscellaneous
User experience
ArcGIS Online has a new design that is more responsive on smaller screens. When using the web site search to find content, you now get a preview of results as you type keywords in the search box. You can also dismiss all your notifications in one click. For more information, see A fresh new look.
For more information
For more information and additional details see the What’s new help topic or view all posts related to this release.

Commenting is not enabled for this article.